

HOLiFOOD Gender Survey and Figures
End 2023, HOLiFOOD did a Gender Survey and Headcount among all members as agreed in D 9.2 HOLiFOOD Gender Policies. the questions for the Survey, You can find here the questions utilised for this Survey.
Below you find HOLiFOOD, WUR and EU gender figures. You find an extended analysis of the headcount figures and the survey in the PPT presentation at the bottom of this page.
When looking into the just analysed headcount for the HOLiFOOD teams, Ine noticed happily HOLiFOOD reached about 50-50% of men and women among the total Consortium members.[1]
Though, she remarked that the highest percentages of over 50% can be found in the lower scientific positions and lower in the higher positions (see infographics). Ine expects that women will grow into these positions as well if enough attention will be paid to it. She referred to what she has been seeing around her and warns against selection of women over men.
HOLiFOOD headcount Dec 2023
Scientific positions | % women, Dec 2023 | Total N |
A- Professor level | 36.4% | 11 |
B – Associate Prof. level | 33.3% | 21 |
C – PhD Graduates | 64.0% | 25 |
D – MSc Graduates | 55.0% | 40 |
Non-scientific positions | 30.8% | 13 |
Totaal | 47.3% | 110 |
The figures show good prospects and monitoring with statistics and critically using support measures is what all universities need to do according to the new EU policies since Sept. 2022. Also here, monitoring require good and detailed data-analysis to expose underlying variety.
If we compare HOLiFOOD and WUR figures, we see HOLiFOOD scores considerably higher at A and C, and only a bit less at the B and D level. Compared to the latest available EU figures of 2018, we see a comparable distribution albeit a bit less at the B-level again but much more on the others. We can only recommend to further support women in HOLiFOOD to indeed grow into further career steps!
WUR scientific positions in person numbers
Dec figures | % women, 2019 | % women, 2023 | Total N, 2019 | Total N, 2023 |
A. Professors | 19.9% | 29.9% | 176 | 224 |
• HL 1+2 haycode | 18.4% | 29.9 % | 114 | 224 |
• Chairholders | 17.9% | 23.3% | 84 | 90 |
• Personal professors | 23.9% | 38.2% | 67 | 89 |
• Extraordinary professors | 13.3% | 17.8% | 15 | 45 |
B. Associate professors | 31.8% | 35.4% | 214 | 381 |
C. Assistant professors | 40.6% | 48.7% | 286 | 554 |
D. PhD students | 54.2% | 57,4% | 716 | 1786 |
For WUR we indeed see remarkable progress in 4 years 2019-2023 which is coupled to new appointments by growing numbers of positions. But the position of extraordinary professor as granted to Ine might slow down the total figure for women in professor positions, although the growth of 2 women to 13 men (13.3%) in 2019 when she started, and now 8 women to 37 men, so 17.8%.
[1] HOLiFOOD data per partner are not given as most have less than 6 hired persons
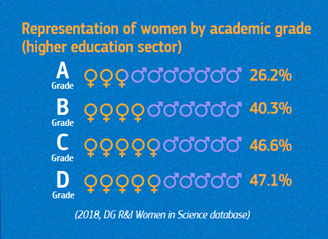
Representation of women by academic grade (higher education sector)
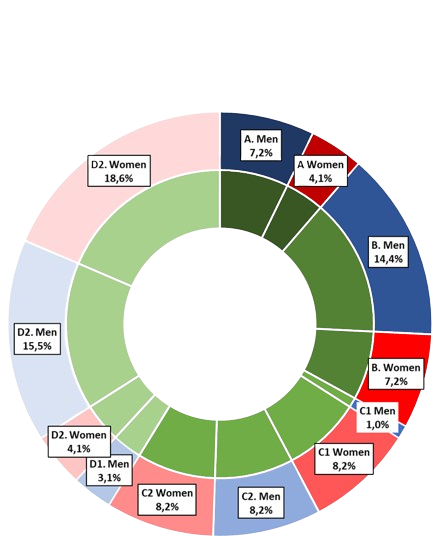
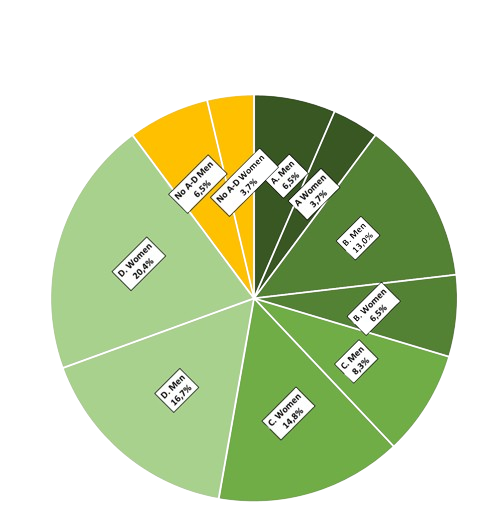
HOLiFOOD consortium composition, % types of scientific positions and non-scientific position, by gender, December 2023
HOLiFOOD consortium composition, % types of scientific positions, by gender, Dec. 2023